log around the clock
Introduction
GDS as a company is both an internet service provider and a consultant in network and system administration at large. One of our clients had an excessive telco bill for his Internet connections. So he asked us to have a closer look into the logs of his cisco router. The typical questions are:
Do we have unwarranted connections during the night or at weekends, when the business and hence the router should be idle? Was there some connection hanging around for several days, unnoticed but causing the meter to run?
I briefly analyzed the log files with the unix "awk" tool to confirm that the telco bill was indeed justified, but there wasn't any single "big culprit" to identify as responsible for the huge costs. I offered to the client a more detailed profile of his connections. I chose to make this research using J, mostly because I wanted to get a bit familiar with J's "dates" library routines.
The raw data
A Cisco router is a well behaved hardware device which doesn't contain any moving parts such as a disk. In order to record a long-term history of events, it is usually configured to send notificicatiosn about whatever you can imagine via the local network to some real computer running a Unix "syslog" daemon which in turn will forward the messages to some file on its harddisk.Said Cisco router logged 35234 lines across October, Novemember and early December 2002. A single outbound call "to the Internet" leaves a trace such as the following:
Oct  1 01:58:25 6X:rpm.rpm.intern 13183: *Mar 28 17:58:09.630: %ISDN-6-LAYER2UP: Layer 2 for Interface BR0, TEI 70 changed to up
Oct  1 01:58:27 3X:rpm.rpm.intern 13184: *Mar 28 17:58:13.046: %LINK-3-UPDOWN: Interface BRI0:1, changed state to up
Oct  1 01:58:28 6X:rpm.rpm.intern 13185: *Mar 28 17:58:13.066: %DIALER-6-BIND: Interface BR0:1 bound to profile Di2
Oct  1 01:58:28 6X:rpm.rpm.intern 13186: *Mar 28 17:58:13.070: %ISDN-6-CONNECT: Interface BRI0:1 is now connected to 00191011
Oct  1 01:58:29 5X:rpm.rpm.intern 13187: *Mar 28 17:58:14.197: %LINEPROTO-5-UPDOWN: Line protocol on Interface BRI0:1, changed state to
up
Oct  1 01:58:34 6X:rpm.rpm.intern 13188: *Mar 28 17:58:19.026: %ISDN-6-CONNECT: Interface BRI0:1 is now connected to 00191011 00191011
Oct  1 02:00:27 6X:rpm.rpm.intern 13189: *Mar 28 18:00:12.257: %DIALER-6-UNBIND: Interface BR0:1 unbound from profile Di2
Oct  1 02:00:27 6X:rpm.rpm.intern 13190: *Mar 28 18:00:12.261: %ISDN-6-DISCONNECT: Interface BRI0:1  disconnected from 00191011 00191011, call lasted 120 seconds
Oct  1 02:00:28 3X:rpm.rpm.intern 13191: *Mar 28 18:00:12.372: %LINK-3-UPDOWN: Interface BRI0:1, changed state to down
Oct  1 02:00:28 5X:rpm.rpm.intern 13192: *Mar 28 18:00:13.364: %LINEPROTO-5-UPDOWN: Line protocol on Interface BRI0:1, changed state to down
Oct  1 02:00:38 6X:rpm.rpm.intern 13193: *Mar 28 18:00:22.450: %ISDN-6-LAYER2DOWN: Layer 2 for Interface BR0, TEI 70 changed to down
Every entry has two time stamps, a correct one from the syslogger and an incorrect one (in "March") from the router which is not sync'ed to any time server.
The Cisco router logs the duration of any connection when it is torn down. A simple "awk" script condenses the logs to the following summary:
$ awk '/disconnected from 00191011/ { print $1, $2, $3, $(NF-1) }' cisco.log
Oct 1 02:00:27 120
Oct 1 02:02:49 120
Oct 1 03:01:26 120
Oct 1 04:02:27 121
Oct 1 04:15:56 126
...
Find all 2924 lines of it (nearly 60 KB) at ftp://ftp.gaertner.de/pub/j/tonline.dur.
plot around the clock
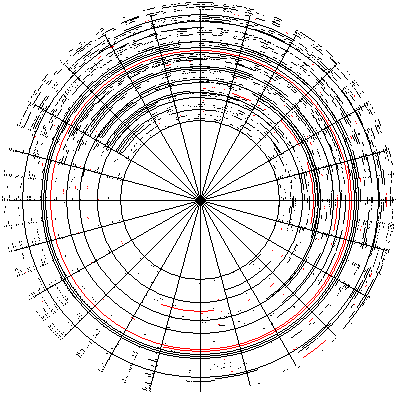
The task now was to take a closer look at this material. The final result is this plot:
This plot shows the period in question with 24 hour circles. The connections on Oct. 1st are plotted on the innermost circle, proceeding rimwards until the outermost circle for December 6th. Midnight is plotted at the very bottom. The 24h day then continues clockwise: with AM the left, high noon at the top and PM to the right. Radials mark the full hours, and one can see nicely how the business starts off at 8am during the week, at least during the first weeks.
As a bonus feature, the colour red is used for connections on the weekends.
glarc trouble
The plot was done using J. The raw data above was once more processed using an awk one-liner to prepare classic APL/J time stamps:2002 10 1 02 00 27 120 2002 10 1 02 02 49 120 2002 10 1 03 01 26 120 2002 10 1 04 02 27 121 2002 10 1 04 15 56 126 ...
After this little pre-filtering and converting (all text munging I still prefer to do with classic Unix tools), it is trivial to digest this matrix within J:
dd =: ".;._2 fread >'user/jdur.txt'
e=: _ 6 {. dd
d=: {:"1 dd
The "dates" standard script utilities a very useful to do the required arithmetic. It can convert the initial time stamps into various other reprentations, most notably milliseconds or days since 1st January 1800". Weekday or leap year computations are things I gladly take from a library instead of committing my own blunders.
The plot itself was not made with the standard "plot" utility of J. I am not very familiar with the styles it offers, but none of the standard styles seemed to do what I needed.
I simply used an "isigraph" control and one "glarc" command per connection. The coordinates for a connection arc are computed via complex numbers and polar coordinates. The "todayno" translates nicely into the radius, i.e. the magnitude of the coordinate, and the seconds since midnight translated into radians becomes the angle of the point which is computd by r..
r=. radius todayno start_day
start_xy =. 500 500 + +. 0j_1 * r r. - +: o. start_time% */24 60 60
Usually, I would simply write _2p1 * start_time... instead of - +: o., but I could not let this occasion pass to have all three inflections of "+" in one line.
The negation in there reflects the change from "mathematically positive" to our "clockwise" orientation used for our plots.
Our complex coordinate can easily be rotated to "midnight goes to bottom" with 0j_1 *.
The +. undoes the r.: it shifts us back into 2D space. The final 500 500 + translates the xy coordinate around the center of the 1000 by 1000 isigraph space.
The first plot
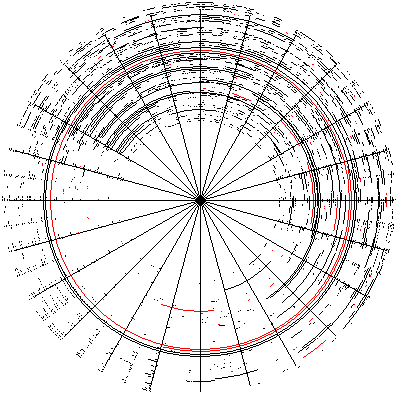
The very first plot brought some surprise for us.
Some preparational analysis (in vulgo: 10 {. dd /: d)
tells us that there is just a single connection longer than
a full day. Nevertheless, the first plot would show eight
additional "full day" connections:
circles:

Stepping through a our plot function, we verified that we passed correct start and end coordinates into the day function. The points were just very close together for the offending connections. Indeed, the concernd connections were all shorter than 20 seconds.
The glarc routine was clearly the culprit for turning tiny mini arcs into full circles. About two days later it dawned upon me that glarc obviously plots a full circle as a feature when starting and ending point are the same or even just "nearly the same". Indeed there is no other way in the gl2 commands to draw a circle. Unfortunately, the threshold criteria for the sameness of starting and ending point are not documented.
Therefore, a quick hack was inserted always use 60 seconds connection time as a minimum. This gave the "correct" plot above. However, when script and data were copied to another Windows machine with a different screen resolution, a handful fake connections re-appeared, so the minium threshold had to be raised again. Would I feel confident enough to package my little clock log plotter as a small product for independent, third party use? No.
Summary
Yet another time, I was rather unsatisfied with the documentation of the J system. Getting the first most simple isigraph output alone on the screen was a major undertaking. I tried in vain to get a simple line plotted from 200,200 to 800,800 for about twenty minutes - thinking I had to initialize pen correctly etc. until I finally resized the window to show more than just the upper left corner.
Setting the pen color to red was an adventure, too. Why the laconic entry
glrgb color - set current colordoes not mention that an invocation of glpen is required, too, is beyond me. When such scant documentation meets funny behaviour such as full circles instead of small stubs, J can be a larger PITA. On the positive side, it really is a joy to juggle around with the data. What I particularly like is the ease with which I can convert between different encodings of data in order to compute with it in the most convenient representation.
Did I have to take performance into account? Not at all. My implementation is quite inelegant in that the plot function computes the glarc parameters for very single connection individually. It could certainly be sped up, but I was happy enough with my three seconds running time for a full plot.
Is J the only possible tool for this job? No. Uwe Faustmann did these plots even nicer in Tcl/Tk (without any J). His version has a scrollable list of all the textual time stamps next to the plot. You can click on any connection either within the plot or within the textual list to highlight the item in the other representation. Way cool, and he did not take any longer to code that. Actually, his alternate implementation made me aware that I had incorrectly described the data set to consist of "start dates and durations" instead of "end dates and durations". Uwe program clearly showed overlapping connections, which I would have never noticed in my J-based plot.
So much for thinking about shipping my script as a product...